6.2. Figure Management#
Technically, every plot widget, hence the plot containing the axes and the content, is represented as an instance of plotItem.
If you show the plot in its own window, this window is called figure and is represented as an instance of figure.
Every figure is also able to show various sub-plots arranged in a regular grid of m rows and n columns. Plots, integrated in an user-defined
interface, are directly integrated there without being part of a special figure.
If you want to continuously use the same figure window for sequentially plotting different data or if you want to use the sub-plot mechanism, it is useful to firstly create or access a specific figure and then plot data objects or camera live images using the specific commands of this figure.
Every figure has a specific handle (integer value). Therefore you can have access to any figure by its figure instance or via the handle value.
In the following example, a new figure is created and opened. The instance is saved in the variable fig:
fig = figure()
Assuming, that you want to access an already existing figure or create a new figure with your desired handle number, give the handle as first argument (keyword: handle):
fig = figure(1)
#or
fig = figure(handle = 1)
fig is then an instance of figure. This class is derived from uiItem and therefore has the same functionality like any other widget
that is represented by uiItem (see Creating customized dialogs, windows and dock widgets). If you provide no further parameter (besides handle) to the figure constructor, a figure with one
plot area is created. If you want to create a grid of more plot areas, you need to give the number of rows and columns as argument to the constructor:
fig = figure(rows = 2, cols = 3)
Not only the module itom has the methods liveImage() in order to plot data objects or camera streams. In the same way, the
class figure has these methods, too:
With method signature:
|
Plots a dataObject, pointCloud or polygonMesh in the current or given area of this figure. |
|
Shows a camera live image in the current or given area of this figure. |
Both have the optional keyword parameter areaIndex, such that you define in which sub-plotting area the requested plot or live image should be depicted. If you don’t provide the areaIndex parameter, the first area (top, left) is assumed (this is also the default in case that you don’t use subplots). The areaIndex value is a fixed-point number beginning with 0 for the top-left area of the figure. Then, the index iterates row-wise through the entire grid of sub-plots.
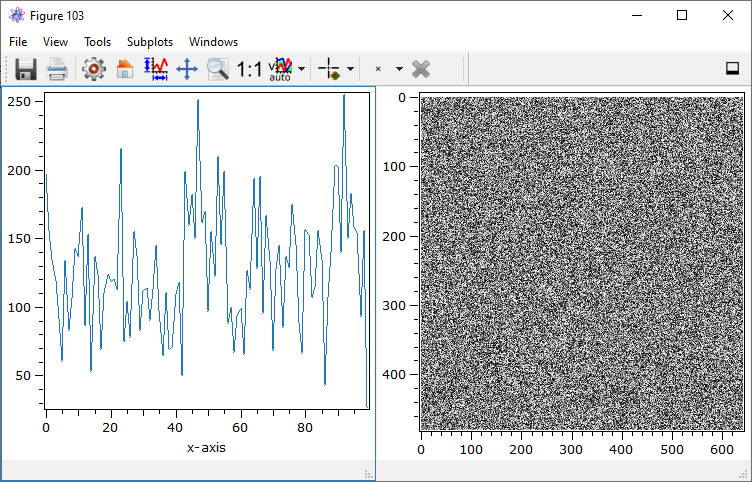
In the following example, a 1x2 grid is created where the left plot shows a 1D data object and the right plot contains the live stream of the dummy grabber camera instance:
fig = figure(rows = 1, cols = 2)
data1d = dataObject.randN([1,100])
fig.plot(data1d, 0)
cam = dataIO("DummyGrabber")
fig.liveImage(cam, 1)
The result looks like this:

The currently depicted toolbar is provided by the active subplot, marked by a border. You can switch the active subplot by choosing your desired one in the figure’s menu subplot.
In order to get the instance of itom.plotItem of any sublot, use the following command:
plotLeft = fig.subplot(0)
plotRight = fig.subplot(1)
Note
In itom versions <= 2.1.0, a figure is only deleted if all references to it have been deleted in Python. Even if the user closed the figure, it was only hidden if at least
one reference was still available in Python. In newer versions of itom, the behaviour changed and was adapted to other plots. If the user closes the figure, it is deleted
and the instance of figure contains an invalid reference.
The figure also provides a static method close() to close and delete a figure defined by its specific integer handle or to close all figures using the string ‘all’ as parameter. Please note, that only these figures are finally deleted where no other python references exist to them.
#close figure with handle 7
figure.close(7)

#close all figures
figure.close('all')
