Note
Go to the end to download the full example code.
12.1.10.2.3. Later shifted image#
In this demo the lateral image shift is determined.
import numpy as np
import scipy
import scipy.misc
import scipy.ndimage
import matplotlib.pyplot as plt
from numpy.typing import ArrayLike


def plotImage(image: ArrayLike, cmap: str = "gray"):
    plt.figure()
    plt.gray()
    plt.imshow(image, cmap=cmap)
    plt.show()


if scipy.__version__ <= "0.14.0":
    # removed due to licensing reasons
    image = scipy.misc.lena()
else:
    image = scipy.misc.face()
    # Convert the image
    R = image[:, :, 0]
    G = image[:, :, 1]
    B = image[:, :, 2]
    image = R * 299.0 / 1000 + G * 587.0 / 1000 + B * 114.0 / 1000

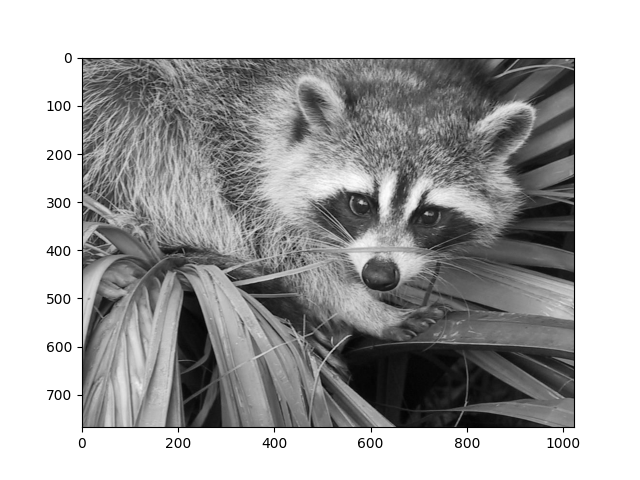
plotImage(image)

C:\Workspace\itom_development_VS2019_Qt5.15.2_x64\itomProject\itom\demo\itom\dataProcessing\demo_LateralShift.py:26: DeprecationWarning:

scipy.misc.face has been deprecated in SciPy v1.10.0; and will be completely removed in SciPy v1.12.0. Dataset methods have moved into the scipy.datasets module. Use scipy.datasets.face instead.
Amount of pixel shift in x- and y-direction
xPixelShift = 16
yPixelShift = -7
Determine the ROI size: relative (centered) size of original image (relativeSize=1: original size).
row, col = image.shape
relativeSize = (
    np.floor(min(1 - abs(xPixelShift) / col, 1 - abs(yPixelShift) / row) * 10) / 10
)

x0 = int((col - col * relativeSize) / 2)
x1 = col - x0 + 1
y0 = int((row - row * relativeSize) / 2)
y1 = row - y0 + 1
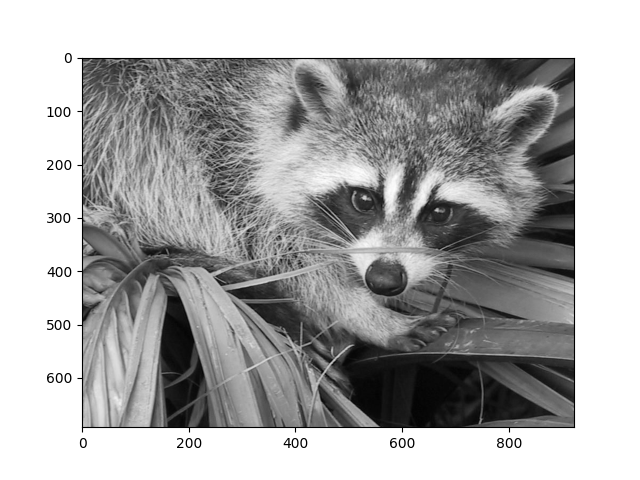
not shifted ROI
image1 = image[y0:y1, x0:x1].copy()
plotImage(image1)

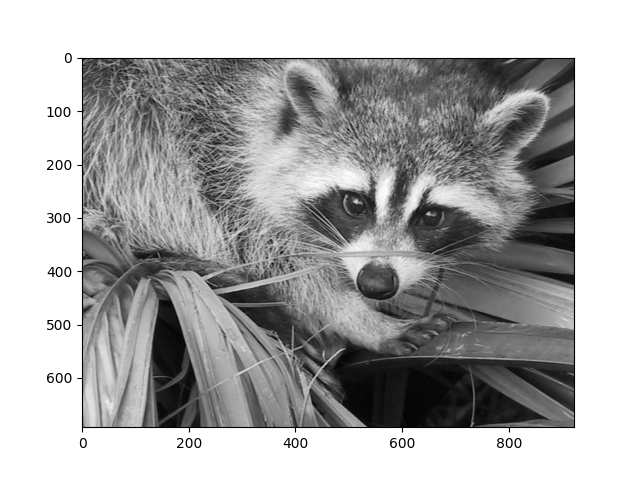
# Shifted ROI
image2 = image[
    y0 + yPixelShift : y1 + yPixelShift, x0 + xPixelShift : x1 + xPixelShift
].copy()
plotImage(image2)
Determine the pixel shift using discrete fast fourier transformation and complex conjugation of image2.
image1FFT = np.fft.fft2(image1)
image2FFT = np.conjugate(np.fft.fft2(image2))

# inverse fourier transformation of product -> equal to cross correlation
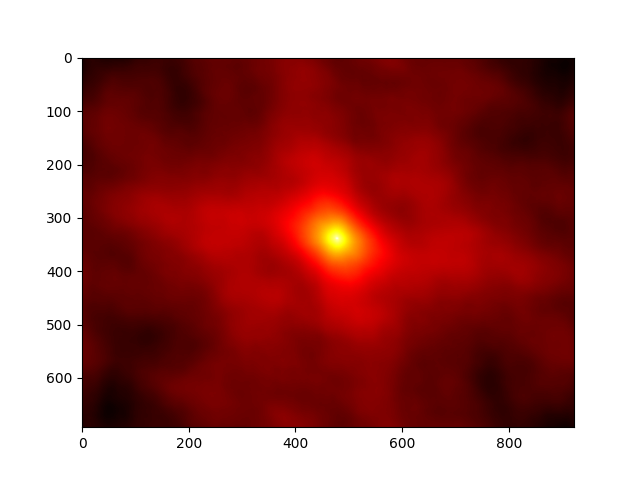
imageCCor = np.real(np.fft.ifft2(image1FFT * image2FFT))

# Shift the zero-frequency component to the center of the spectrum
imageCCorShift = np.fft.fftshift(imageCCor)
plotImage(imageCCorShift, "hot")

Determine the distance of the maximum from the center
row, col = image1.shape

yShift, xShift = np.unravel_index(np.argmax(imageCCorShift), (row, col))

yShift -= int(row / 2)
xShift -= int(col / 2)

print("shift of image1 in x-direction [pixel]: " + str(xShift))
print("shift of image1 in y-direction [pixel]: " + str(yShift))
shift of image1 in x-direction [pixel]: 16
shift of image1 in y-direction [pixel]: -7
Total running time of the script: (0 minutes 11.868 seconds)


