Note
Go to the end to download the full example code.
12.1.10.3.1. Matplotlib embedded in GUI#
This examples shows how the matplotlib can be integrated
into a GUI based on the MatplotlibPlot Qt Designer plugin.
import numpy as np
import matplotlib.pyplot as plt
from itom import ui
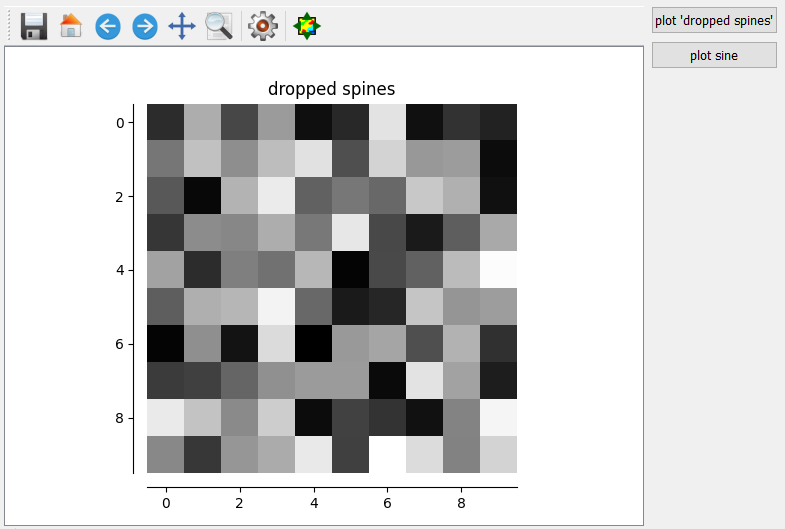
Plots spines into the MatplotlibPlot Qt Designer plugin.
def plotDroppedSpines():
    """
    plot taken from matplotlib example 'spines_demo_dropped.py'
    """
    canvas = gui.plot  # reference to matplotlibPlot widget

    # if the same figure object in the matplotlib figure manager should
    # be reused, since it is assigned to the pre-defined canvas in the ui
    # file, you need to always set a unique number (can be arbitrary, but unique)
    fig = plt.figure(num=3, canvas=canvas)

    if len(fig.axes) == 0:
        # create a new subplot in the figure
        ax = fig.add_subplot(111)
    else:
        # reuse the existing first subplot
        ax = fig.axes[0]
        ax.clear()

    image = np.random.uniform(size=(10, 10))
    ax.imshow(image, cmap=plt.cm.gray, interpolation="nearest")
    ax.set_title("dropped spines")

    # Move left and bottom spines outward by 10 points
    ax.spines["left"].set_position(("outward", 10))
    ax.spines["bottom"].set_position(("outward", 10))
    # Hide the right and top spines
    ax.spines["right"].set_visible(False)
    ax.spines["top"].set_visible(False)
    # Only show ticks on the left and bottom spines
    ax.yaxis.set_ticks_position("left")
    ax.xaxis.set_ticks_position("bottom")

    plt.show()

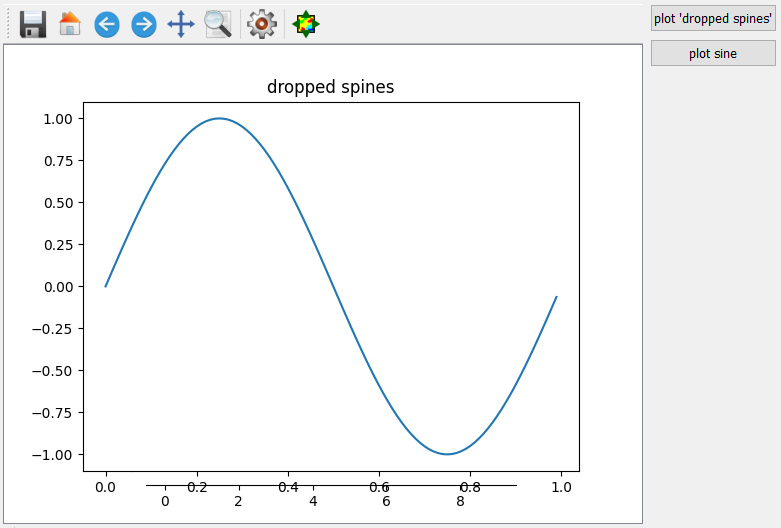
Plots a sine curve into the MatplotlibPlot Qt Designer plugin.
def plotSine():
    """
    plots sine, taken from matplotlib gallery examples
    """
    t = np.arange(0.0, 1.0, 0.01)
    s = np.sin(2 * np.pi * t)

    canvas = gui.plot  # reference to matplotlibPlot widget
    fig = plt.figure(num=3, canvas=canvas)

    if len(fig.axes) == 0:
        # create a new subplot in the figure
        ax = fig.add_subplot(111)
    else:
        # reuse the existing first subplot
        ax = fig.axes[0]
        ax.clear()

    ax.plot(t, s)

    plt.show()


gui = ui("matplotlibGui.ui", type=ui.TYPEWINDOW)
gui.btnSine.connect("clicked()", plotSine)
gui.btnDroppedSpines.connect("clicked()", plotDroppedSpines)
gui.show()

# if you call this script for the second time, the given figure-num (3)
# is already in used for the lastly closed figure. Therefore also tell
# matplotlib to close this figure handle.
plt.close(3)

Total running time of the script: (0 minutes 0.032 seconds)
