5.1.3.4. Breakpoints#
As you already learned in the section debugging python scripts, it is possible to set and configure breakpoints in all scripts. Once the python interpreter is executed in debug mode, it will stop at any defined breakpoint.

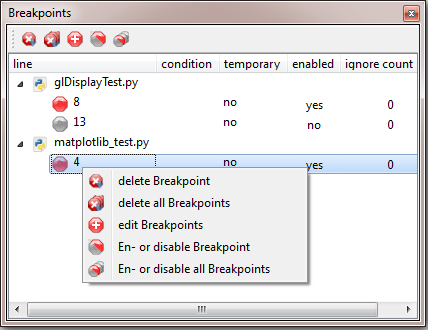
The breakpoint toolbox gives you an overview about all breakpoints that are currently registered in the python debugger. These breakpoints are saved on shutdown of itom and restored at the next startup. Breakpoints can even be active if the corresponding script file is currently not opened; it will be opened once the debugger stops at the corresponding breakpoint.
In the toolbox, all breakpoints are sorted by the script file and the line number. A red dot indicates that the breakpoint is active, a gray dot stands for a disabled breakpoint. Using the context menu or the buttons in the toolbox, you have the following possibilities:
Delete the breakpoint that is currently selected (one single breakpoint, the one that has the focus).
En- or disable the breakpoint that is currently selected.
Delete all breakpoints
Toggle the status (en- or disable) or all breakpoints
Edit the breakpoint that is currently selected.
The configuration of every breakpoint is displayed in the corresponding columns. For more information about this, please see the documentation.
