Note
Go to the end to download the full example code.
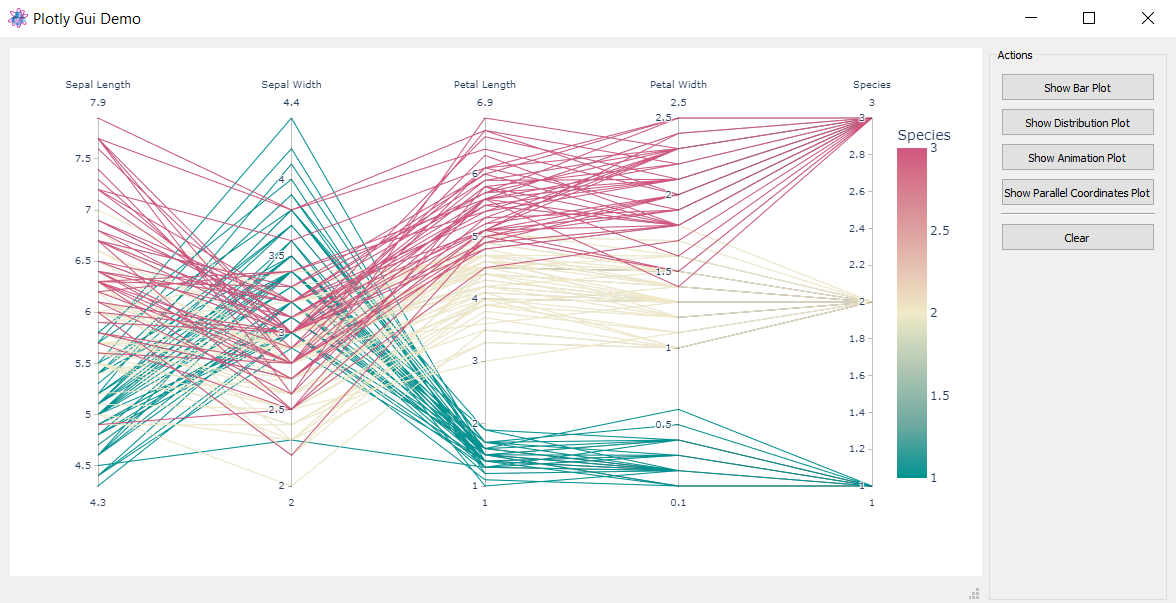
12.3.10.6.3. GUI integrated#
This demo shows how to render to output of the Python plotly library in
custom user interfaces.
In the given ‘.ui’ file, a widget of the class type PlotlyPlot is placed.
If the ItomPlotlyRenderer renderer class is loaded and assigned as renderer
to ploty, the show method of the plotly.graph_objects.Figure class has
another optional keyword argument plotHandle, where you can pass the
itom.plotHandle object of the corresponding widget in the ui file. Then
the output is rendered in this widget.
# this module must be imported in order to load an itom specific renderer
# for plotly and assign it as default.
import itomPlotlyRenderer

import plotly.express as px

# import the base class ItomUi from the module itomUi in the itom-packages subfolder
from itomUi import ItomUi
from itom import ui


class PlotlyGuiDemo(ItomUi):
    def __init__(self):
        """Constructor."""
        ItomUi.__init__(self, "plotlyGuiDemo.ui", ui.TYPEWINDOW, deleteOnClose=True)
        self.plotlyPlot = self.gui.plotlyPlot

    @ItomUi.autoslot("")
    def on_btnClear_clicked(self):
        """Clear the canvas."""
        self.plotlyPlot.call("setHtml", "")

    @ItomUi.autoslot("")
    def on_btnPlot1_clicked(self):
        """From the bar plot demo of plotly.

        https://plotly.com/python/bar-charts/
        """
        with self.disableGui(disableItems=[self.gui.groupActions]):
            long_df = px.data.medals_long()

            fig = px.bar(
                long_df, x="nation", y="count", color="medal", title="Long-Form Input"
            )
            fig.show(plotHandle=self.plotlyPlot)

    @ItomUi.autoslot("")
    def on_btnPlot2_clicked(self):
        """From the distplot demo of plotly.

        https://plotly.com/python/distplot/
        """
        with self.disableGui(disableItems=[self.gui.groupActions]):
            df = px.data.tips()
            fig = px.histogram(
                df,
                x="total_bill",
                y="tip",
                color="sex",
                marginal="rug",
                hover_data=df.columns,
            )
            fig.show(plotHandle=self.plotlyPlot)

    @ItomUi.autoslot("")
    def on_btnPlot3_clicked(self):
        """From the animations demo of plotly.

        https://plotly.com/python/animations/
        """
        with self.disableGui(disableItems=[self.gui.groupActions]):
            df = px.data.gapminder()

            fig = px.bar(
                df,
                x="continent",
                y="pop",
                color="continent",
                animation_frame="year",
                animation_group="country",
                range_y=[0, 4000000000],
            )
            fig.show(plotHandle=self.plotlyPlot)

    @ItomUi.autoslot("")
    def on_btnPlot4_clicked(self):
        """From the parallel coordinates plot demo of plotly.

        https://plotly.com/python/parallel-coordinates-plot/
        """
        with self.disableGui(disableItems=[self.gui.groupActions]):
            df = px.data.iris()
            fig = px.parallel_coordinates(
                df,
                color="species_id",
                labels={
                    "species_id": "Species",
                    "sepal_width": "Sepal Width",
                    "sepal_length": "Sepal Length",
                    "petal_width": "Petal Width",
                    "petal_length": "Petal Length",
                },
                color_continuous_scale=px.colors.diverging.Tealrose,
                color_continuous_midpoint=2,
            )
            fig.show(plotHandle=self.plotlyPlot)


if __name__ == "__main__":
    win = PlotlyGuiDemo()
    win.show()