Ctrl+K
itom Documentation - Home
  • Changelog
  • Introduction
  • Installation
  • Getting Started
  • The itom User Interface
    • Plots and Figures
    • Extending the user interface of itom
    • Plugins
    • Python Scripting Language
    • itom Script Reference
    • Miscellaneous
    • Demo scripts
    • Contributing
  • GitHub
  • ITO
  • Changelog
  • Introduction
  • Installation
  • Getting Started
  • The itom User Interface
  • Plots and Figures
  • Extending the user interface of itom
  • Plugins
  • Python Scripting Language
  • itom Script Reference
  • Miscellaneous
  • Demo scripts
  • Contributing
  • GitHub
  • ITO

Section Navigation

  • 12.1. itom
  • 12.2. Python
  • 12.3. Python packages
    • 12.3.10.1. Matplotlib
    • 12.3.10.2. Numpy
    • 12.3.10.3. others
    • 12.3.10.4. Pandas
    • 12.3.10.5. Parallelization and Threading
    • 12.3.10.6. Plotly
    • 12.3.10.7. PyTest
    • 12.3.10.8. Scikit-learn
    • 12.3.10.9. Scipy
      • 12.3.10.9.1. Scipy
      • 12.3.10.9.2. Nearest neighbors
      • 12.3.10.9.3. Signal correlation
    • 12.3.10.10. Seaborn
  • 12. Demo scripts
  • 12.3. Python packages

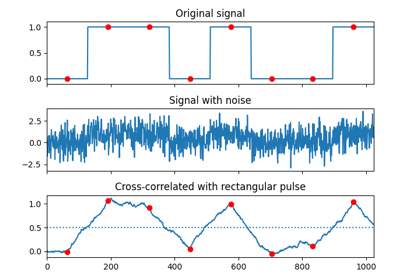
12.3.10.9. Scipy#

Scipy

Scipy

Nearest neighbors

Nearest neighbors

Signal correlation

Signal correlation

previous

12.3.10.8.3. K-Means clustering

next

12.3.10.9.1. Scipy

Show Source

© Copyright 2011-2024, Institut für Technische Optik (ITO), Universität Stuttgart. Bug report: https://github.com/itom-project/itom/issues.

Created using Sphinx 8.1.3.

Built with the PyData Sphinx Theme 0.15.4.