Note
Go to the end to download the full example code.
12.3.10.9.1. Scipy#
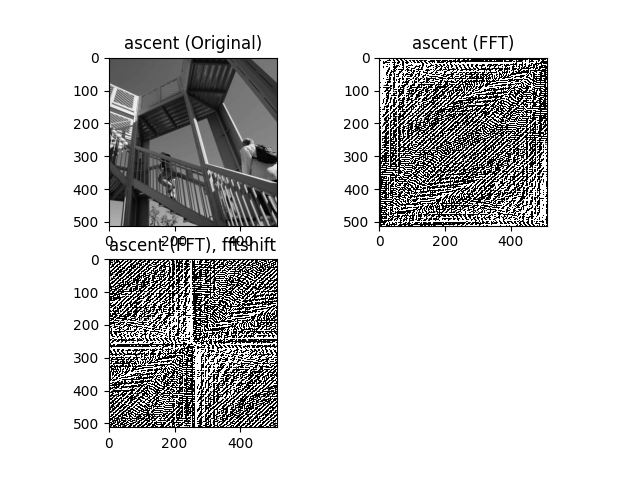
Opens the ascent image from scipy.misc and shifts the image.
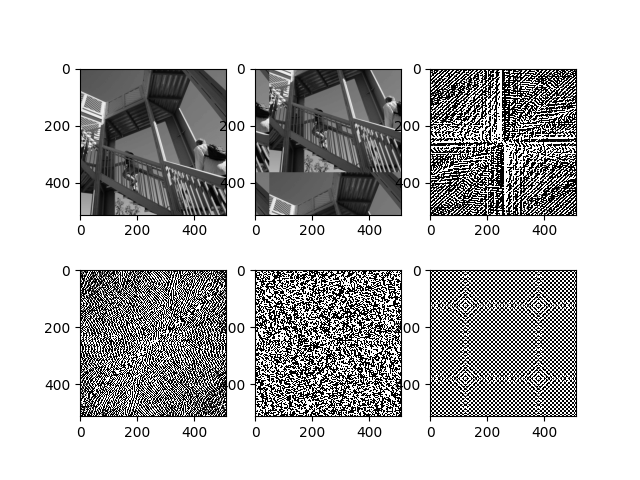
Finally, the shift offsets are determined using cross-correlation.
import scipy.misc
import numpy
from numpy.fft import fft2
from numpy.fft import fftshift
import pylab
Get the ascent image and calculate an offset shift.
ascent = scipy.misc.ascent()
print("The ascent-image has a size of", ascent.shape)
print("The maximum value of this image is ", ascent.max())
print("Its data type is ", ascent.dtype)

F = fft2(ascent)
F2 = fftshift(F)

pylab.figure()
pylab.gray()
pylab.subplot(221)
pylab.imshow(ascent)
pylab.title("ascent (Original)")

pylab.subplot(222)
img = pylab.imshow(numpy.real(F))
img.set_clim(0, 100)
pylab.title("ascent (FFT)")

pylab.subplot(223)
img = pylab.imshow(numpy.real(F2))
img.set_clim(0, 100)
pylab.title("ascent (FFT), fftshift")

C:\Workspace\itom_development_VS2019_Qt5.15.2_x64\itomProject\itom\demo\python_packages\scipy\demo_Scipy.py:17: DeprecationWarning:

scipy.misc.ascent has been deprecated in SciPy v1.10.0; and will be completely removed in SciPy v1.12.0. Dataset methods have moved into the scipy.datasets module. Use scipy.datasets.ascent instead.

The ascent-image has a size of (512, 512)
The maximum value of this image is  255
Its data type is  int32

Text(0.5, 1.0, 'ascent (FFT), fftshift')
Calculate the cross-correlation.
pylab.figure()
pylab.subplot(231)
pylab.imshow(ascent)

ascent_roll = numpy.roll(ascent, 50, 1)
ascent_roll = numpy.roll(ascent_roll, -150, 0)

pylab.subplot(232)
pylab.imshow(ascent_roll)

F = fftshift(fft2(ascent))
F2 = fftshift(fft2(ascent_roll))

F3 = numpy.multiply(F, F2.conj())

F4 = fftshift(numpy.fft.ifft2(F3))

pylab.subplot(233)
img = pylab.imshow(numpy.real(F))
img.set_clim(0, 100)

pylab.subplot(234)
img = pylab.imshow(numpy.real(F2))
img.set_clim(0, 100)

pylab.subplot(235)
img = pylab.imshow(numpy.real(F3))
img.set_clim(0, 100)

pylab.subplot(236)
F5 = numpy.real(F4)
img = pylab.imshow(F5, vmin=0, vmax=0.001)

max_pos = numpy.argmax(F5)

offset_x = max_pos % 512
offset_y = (max_pos - offset_x) / 512

print("offset_x: ", offset_x - 256)
print("offset_y: ", offset_y - 256)

pylab.show()

offset_x:  -50
offset_y:  150.0
Total running time of the script: (0 minutes 0.417 seconds)
