
Note
Go to the end to download the full example code.
12.3.10.4.8. Plotting#
import pandas as pd
import numpy as np
import matplotlib.pyplot as plt
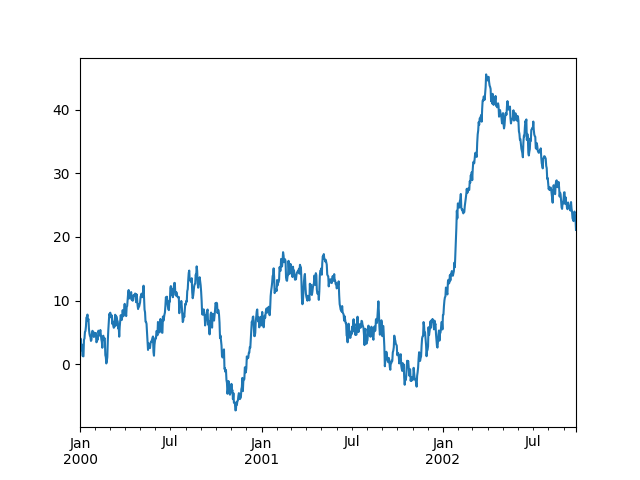
plt.figure()
timestamps = pd.Series(
    np.random.randn(1000), index=pd.date_range("1/1/2000", periods=1000)
)
timestamps = timestamps.cumsum()
timestamps.plot()
plt.show()
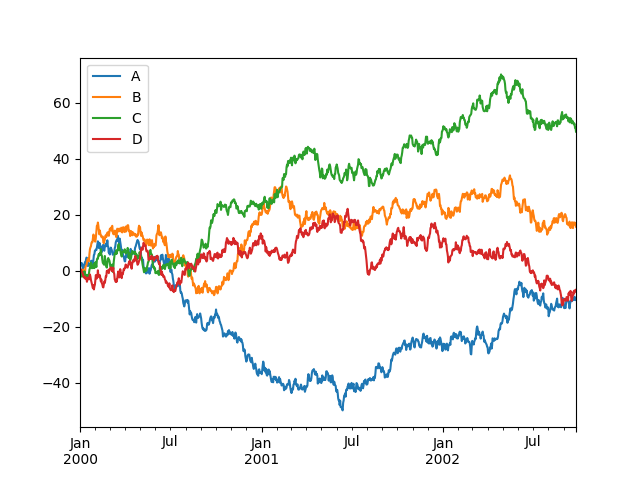
dataFrame = pd.DataFrame(
    np.random.randn(1000, 4), index=timestamps.index, columns=["A", "B", "C", "D"]
)
dataFrame = dataFrame.cumsum()
plt.figure()
dataFrame.plot()
plt.legend(loc="best")

<matplotlib.legend.Legend object at 0x000002CBD07A5E50>
Total running time of the script: (0 minutes 0.325 seconds)