Note
Go to the end to download the full example code.
12.3.10.1.19. Quantum Black Styles#
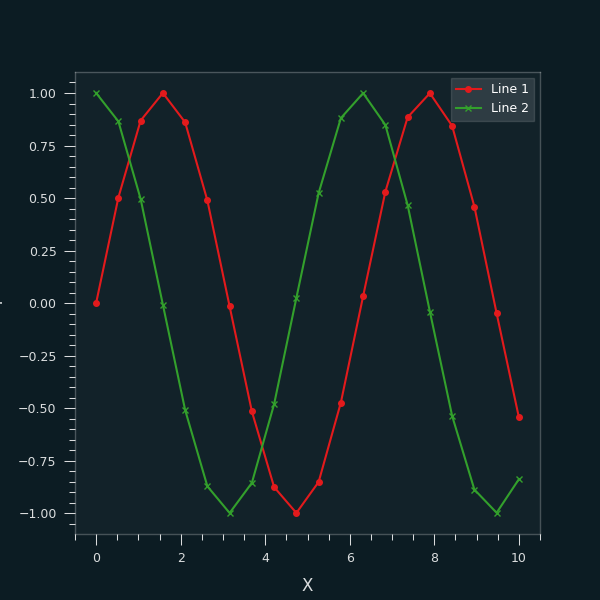
This matplotlib style Quantum Black Styles generates figures in dark style. In addition to matplotlib, the style must be installed.
pip install qbstyles
Import namespaces.
import numpy as np
import matplotlib.pyplot as plt
from qbstyles import mpl_style
Generate demo x and y values.
x = np.linspace(0, 10, 20)
y = np.sin(x)
y2 = np.cos(x)
Set dark style.
mpl_style(dark=True)
Plot data.
plt.figure(figsize=(6, 6))
plt.plot(x, y, marker="o", label="Line 1")
plt.plot(x, y2, marker="x", label="Line 2")

plt.xlabel("X")
plt.ylabel("Y")
plt.legend()
plt.grid()
plt.show()

Total running time of the script: (0 minutes 0.092 seconds)
