Note
Go to the end to download the full example code.
12.3.10.1.21. Science Plots#
This matplotlib style Science Plots is focused to generate figures using common scientific journal styles such as IEEE. The figures are suitable to print in colored are back and white. In addition to matplotlib, the style must be installed.
pip install SciencePlots
Import namespaces.
import numpy as np
import matplotlib.pyplot as plt
import scienceplots
Generate demo x and y values.
x = np.linspace(0, 10, 20)
y = np.sin(x)
y2 = np.cos(x)
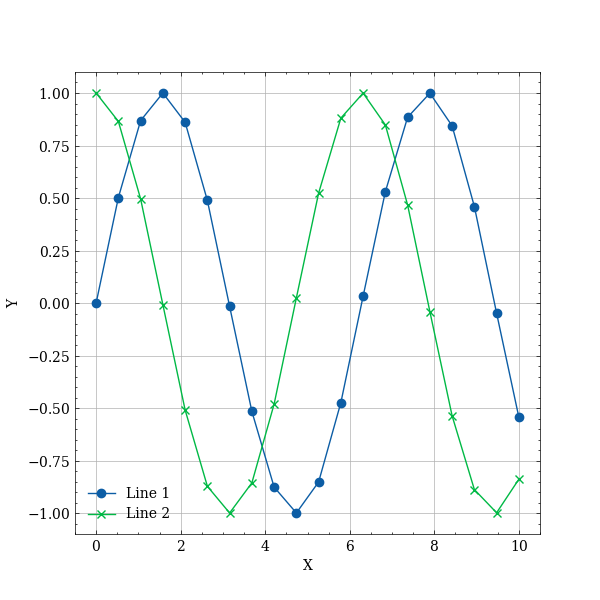
Change matplotlib.pyplot style and plot data.
with plt.style.context(["science", "no-latex"]):
    plt.figure(figsize=(6, 6))
    plt.plot(x, y, marker="o", label="Line 1")
    plt.plot(x, y2, marker="x", label="Line 2")

    plt.xlabel("X")
    plt.ylabel("Y")
    plt.legend()
    plt.grid()
    plt.show()

Total running time of the script: (0 minutes 0.204 seconds)
