
Note
Go to the end to download the full example code.
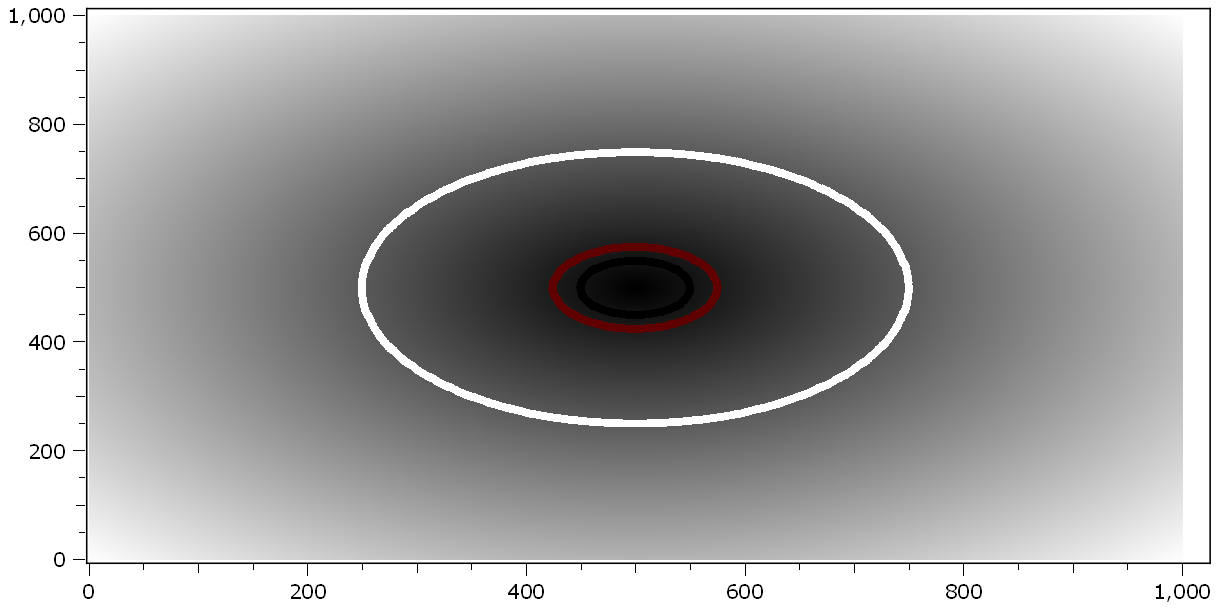
12.1.10.5.4. Contourlines 2D plot#
This demo shows how to display contour lines in an itom.plot2.
The contour levels can be set via the contourLevels property.
The expected type is a dataObject of shape 1 x N of type
uint8, int8, uint16, int16, int32,
float32 or float64. The line width and color map can
be adjusted by setting the property contourLineWidth and
contourColorMap respectively.
import numpy as np
from itom import dataObject
from itom import plot

vec = np.linspace(-500, 501, 1001)
x, y = np.meshgrid(vec, vec)
r = np.sqrt(x**2 + y**2)

[idx, handle] = plot(r)
levels = dataObject.randN([1, 3], "uint8")
levels[0, 0] = 50
levels[0, 1] = 75
levels[0, 2] = 250

handle["contourLevels"] = levels
handle["contourColorMap"] = "hotIron"
handle["contourLineWidth"] = 5
Total running time of the script: (0 minutes 0.092 seconds)