Note
Go to the end to download the full example code.
12.1.10.5.21. Plot XY#
This demo shows how to set an optional x-vector to an 1D-plot.
The optional x-vector can be set by passing the optional x-vector as second argument to the plot1 function
or by setting the property xData of an existing plot.
If you want to add a x-vector to a plot of an N x M dataObject
your x-vector has to be an dataObject of shape 1 x M.
Once you add an x-vector with a last dimension greater M the last points will be ignored.
import numpy as np
from itom import plot
from itom import plot1
from itom import dataObject
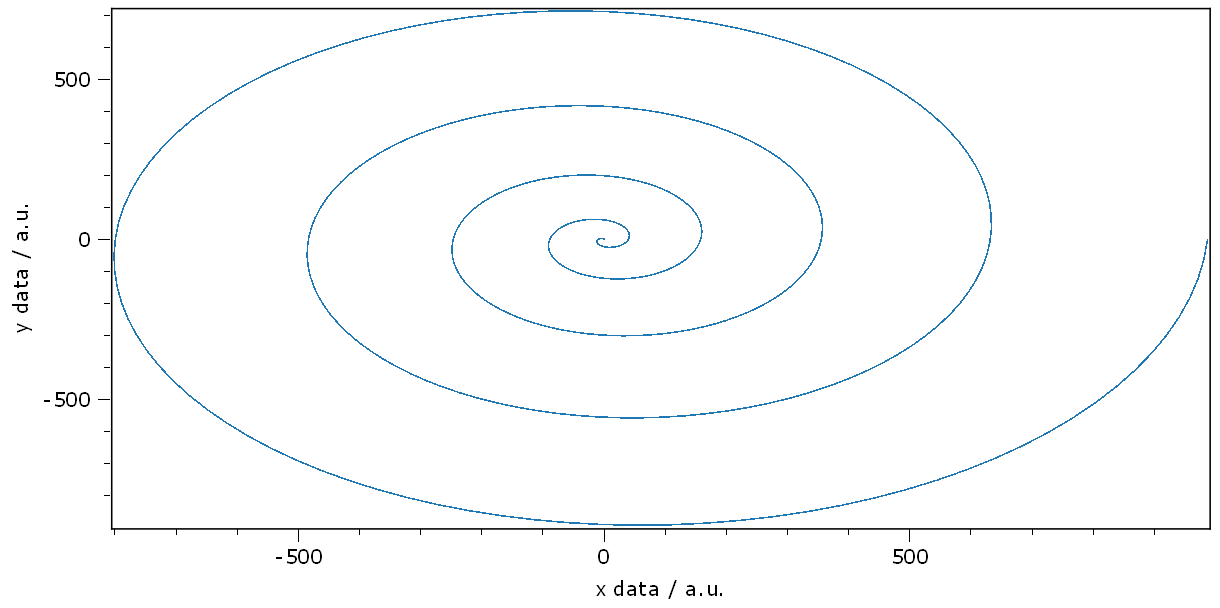
Create a spirale and plot it.
angle = np.linspace(0, 10 * np.pi, num=500)
x = dataObject([1, angle.shape[0]], dtype="float32")
y = dataObject([1, angle.shape[0]], dtype="float32")

# for the axis labels the valueDescription and valueUnit of the two data is used
x.valueDescription = "x data"
x.valueUnit = "a.u."

y.valueDescription = "y data"
y.valueUnit = "a.u."

radius = angle**2
x[:, :] = (radius * np.cos(angle)).astype("float32")
y[:, :] = (radius * np.sin(angle)).astype("float32")

# alternative 1: use the itom.plot1 method
plot1(y, x)
(140, PlotItem(UiItem(class: Itom1DQwtPlot, name: plot0x0)))

Alternative 2: Create a default line plot and then assign the
x-coordinates to the xData property.
fig = plot(y)
fig[-1]["xData"] = x
Alternative 3: like #2 but in one line
plot(y, properties={"xData": x})
(142, PlotItem(UiItem(class: Itom1DQwtPlot, name: plot0x0)))
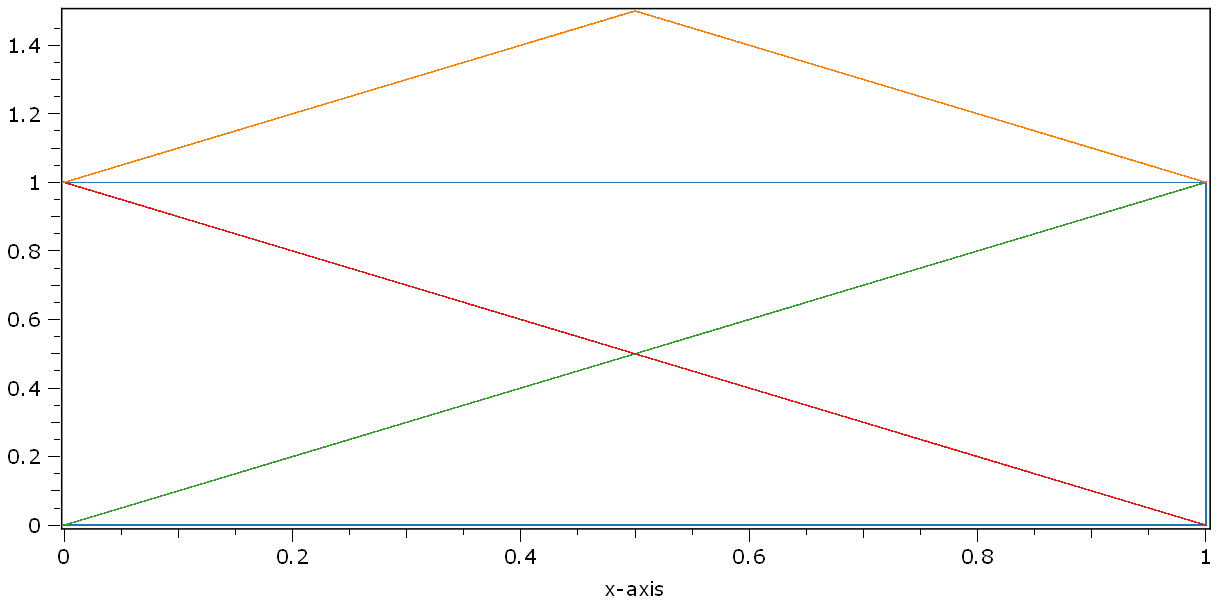
This section shows you how to draw multiple lines of different length.
yPoints = dataObject([4, 4], "float32")
xPoints = dataObject([4, 4], "float32")

# fill the dataObjects with nans to ignore values which are not needed
yPoints[:, :] = np.nan
xPoints[:, :] = np.nan

# first line
yPoints[0, 0] = 0
xPoints[0, 0] = 0
yPoints[0, 1] = 0
xPoints[0, 1] = 1
yPoints[0, 2] = 1
xPoints[0, 2] = 1
yPoints[0, 3] = 1
xPoints[0, 3] = 0

# second line
yPoints[1, 0:2] = (0, 1)
xPoints[1, 0:2] = (0, 1)

# third line
yPoints[2, 0] = 1
xPoints[2, 0] = 0
yPoints[2, 1] = 0
xPoints[2, 1] = 1

# fourth line
yPoints[3, 0] = 1
xPoints[3, 0] = 0
yPoints[3, 1] = 1.5
xPoints[3, 1] = 0.5
yPoints[3, 2] = 1
xPoints[3, 2] = 1

plot1(yPoints, xPoints)
(143, PlotItem(UiItem(class: Itom1DQwtPlot, name: plot0x0)))

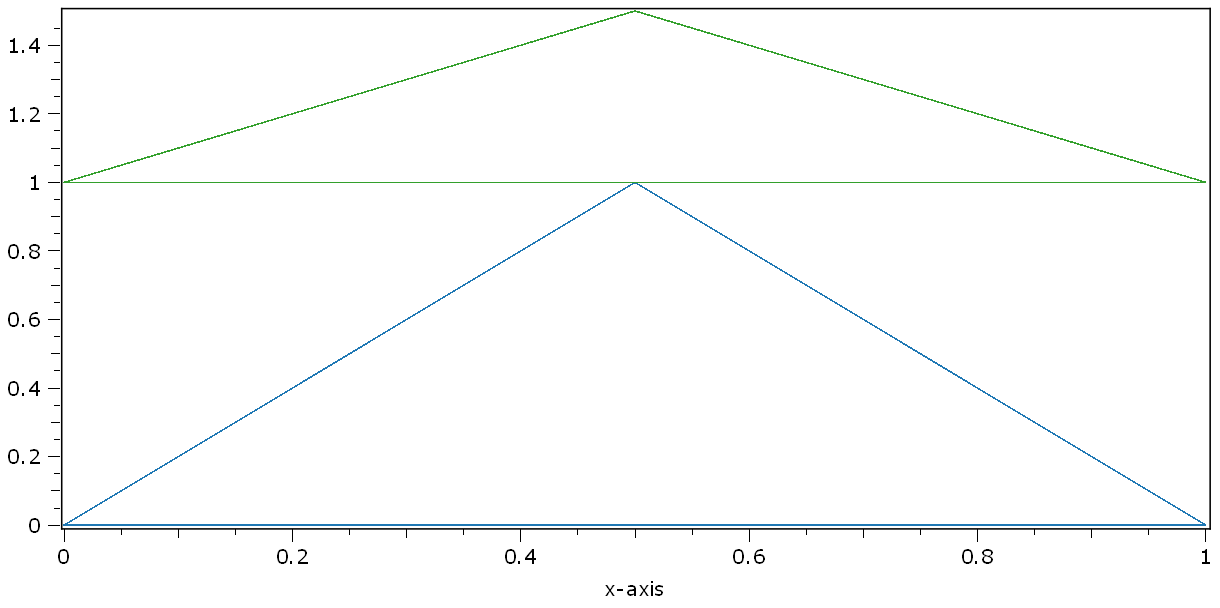
This section demonstrates how to draw multiple lines with a common array of x-coordinates.
multipleY = dataObject([2, 4], "float32")
# it is also possible to use a too long xData set. The last values will be ignored.
singleX = dataObject([1, 9], "float32")

singleX[0, 0:4] = (0, 1, 0.5, 0)
multipleY[0, :] = (0, 0, 1, 0)
multipleY[1, :] = (1, 1, 1.5, 1)

plot1(multipleY, singleX)
(144, PlotItem(UiItem(class: Itom1DQwtPlot, name: plot0x0)))

Total running time of the script: (0 minutes 0.334 seconds)
