
Note
Go to the end to download the full example code.
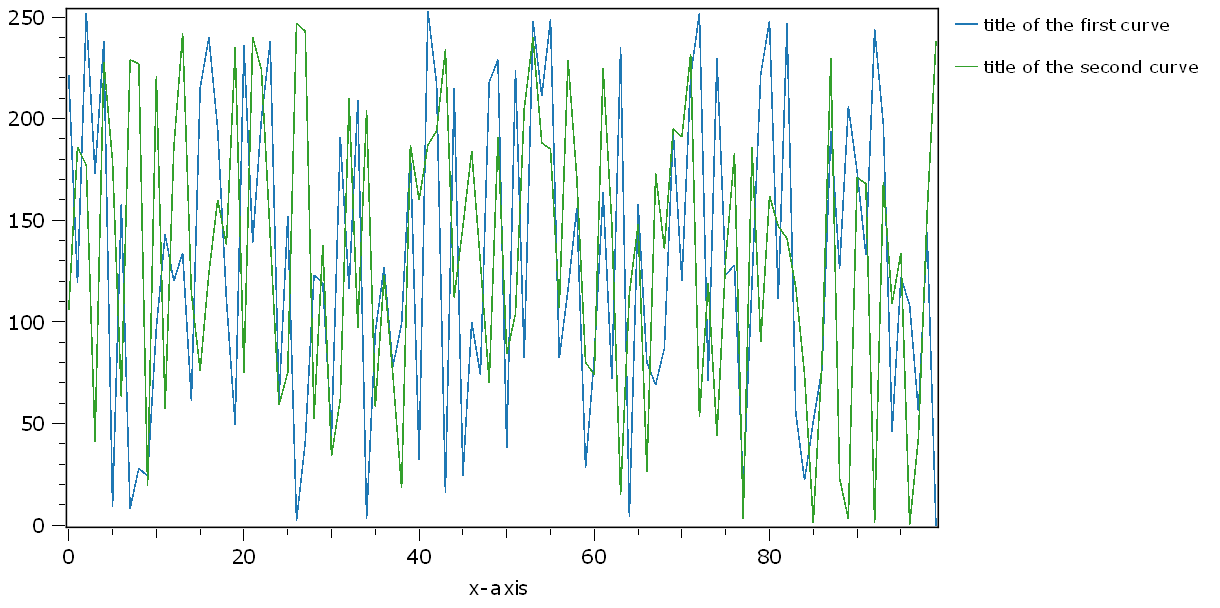
12.1.10.5.6. 1D Legend title#
This demo shows how to define dataObject tags, which are used
as legendTitles in the 1D plot. You have to set the tags legendTitle0
legendTitle1, legendTitle2, …, according to the curve index and
the legend label text.
from itom import dataObject
from itom import plot1

dObj = dataObject.rand([2, 100])
dObj.setTag("legendTitle0", "title of the first curve")
dObj.setTag("legendTitle1", "title of the second curve")

print(dObj.tags)
plot1(dObj, properties={"legendPosition": "Right"})
{'legendTitle0': 'title of the first curve', 'legendTitle1': 'title of the second curve'}

(125, PlotItem(UiItem(class: Itom1DQwtPlot, name: plot0x0)))
Total running time of the script: (0 minutes 0.060 seconds)