
Note
Go to the end to download the full example code.
12.1.10.5.20. Plot 2.5D/ 3D#
The itom twipOGLFigure plot is for visualisation of 2D / 3D DataObjects and PointClouds.
import numpy as np
from itom import plot25
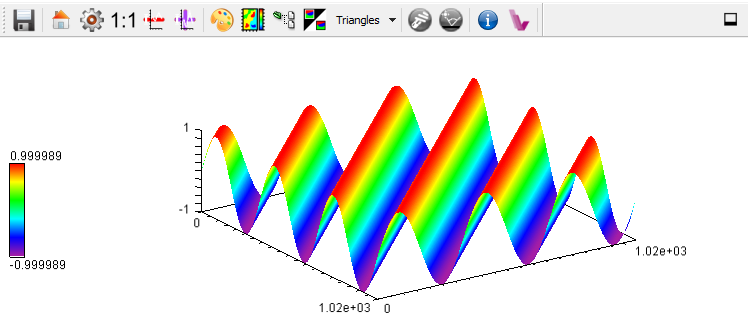
A two dimensional sinus wave is generated und plotted using the TwipOGLFigure.
N = 1024
amplitude = 128.0
periodes = 3

xs = np.linspace(-periodes * np.pi, periodes * np.pi, N)
ys = np.linspace(-periodes * np.pi, periodes * np.pi, N)

tau, phi = np.meshgrid(xs, ys)

amp = np.sin(tau + phi)


plot25(amp)
(139, PlotItem(UiItem(class: TwipOGLFigure, name: plot0x0)))
Total running time of the script: (0 minutes 0.082 seconds)