Note
Go to the end to download the full example code.
12.1.10.5.11. VTK 3D Visualizer#
The Vtk3dVisualizer can be used to visualize the following items:
pointClouds
polygonMeshes
geometric items like cuboids, pyramids, cylinders, spheres
text at arbitrary 3D positions
import numpy as np

try:
    from itom import pointCloud
except Exception as ex:
    ui.msgInformation(
        "PointCloud missing",
        "your itom version is compiled without support of pointClouds",
    )
    raise ex


from itom import polygonMesh
from itom import dataObject
from itom import plot
from itom import algorithms
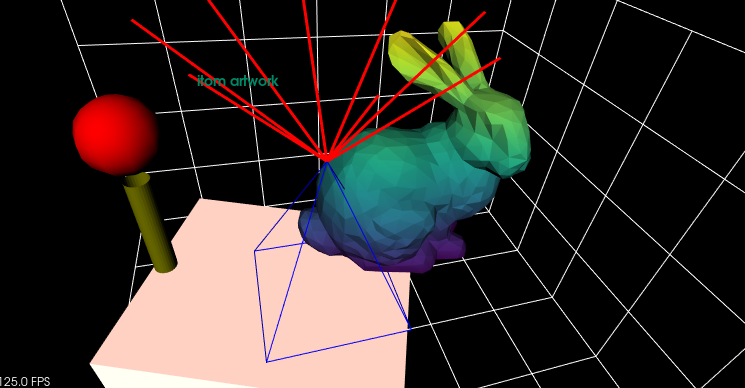
Load a polygonal mesh of a bunny.
bunny = polygonMesh()
algorithms.loadPolygonMesh(bunny, "bunny.obj")
trafo = dataObject.eye(4, "float64")
trafo[1, 1] = 0
trafo[2, 2] = 0
trafo[1, 2] = 1
trafo[2, 1] = 1
trafo[0:3, 3] = (0, 0, -2)
bunny_transformed_mesh = polygonMesh()
algorithms.meshTransformAffine(bunny, bunny_transformed_mesh, trafo)

[i, h] = plot(bunny_transformed_mesh, "Vtk3dVisualizer")
Configure the mesh (called source_mesh).
h.call("setItemProperty", "source_mesh", "ColorMode", "Z")
h.call("setItemProperty", "source_mesh", "ColorMap", "viridis")
A cylinder is added to the canvas. The axis of symmetry is given by a start point and an orientation vector. The length of the orientation vector defines the height of the cylinder, its radius is given by the third parameter.
h.call(
    "addCylinder", (10, 0, 0), (0, 0, 5), 0.5, "cylinder"
)  # arguments: point, orientation, radius, name
h.call("setItemProperty", "cylinder", "Representation", "Surface")
h.call("setItemProperty", "cylinder", "LineColor", "#808000")
h.call("setItemProperty", "cylinder", "Lighting", True)
A sphere is added on top of the cylinder. Its center is given as first parameter, followed by the radius.
h.call("addSphere", (10, 0, 7), 1.5, "sphere")
h.call("setItemProperty", "sphere", "Interpolation", "Gouraud")
h.call("setItemProperty", "sphere", "Lighting", True)
A pyramid is added. It is defined by its five corner points using a 3 x 5 dataObject. The first four
columns hereby describe the corner points of the base rectangle, the last column are the x, y, z
coordinates of the tip. Currently, a pyramid only consists of line and no surface representation is possible.
pyramid = np.array([[0, 0, 6, 6, 3], [0, 6, 6, 0, 3], [0, 0, 0, 0, 7]])
h.call("addPyramid", dataObject(pyramid), "pyramid")
h.call("setItemProperty", "pyramid", "LineColor", "blue")
Add a cube with a side length of (12, 10, 2) [x, y, z]. The cube is originally centered at the origin (0,0,0).
The second parameter however translates it by (dx, dy, dz). The third vector contains rotations around
the x-, y- and z-axis in rad. As alternative to ‘addCube’, it is also possible to use addCuboid that has the
coordinates of the 8 corner points as 3x8 dataObject (first argument).
h.call("addCube", (12, 10, 2), (5, 2, -1.2), (0, 0, -np.pi / 8), "cube")
h.call("setItemProperty", "cube", "Lighting", True)
h.call("setItemProperty", "cube", "Representation", "Surface")
h.call("setItemProperty", "cube", "LineColor", "white")
h.call("setItemProperty", "cube", "Specular", 0.8)
h.call("setItemProperty", "cube", "SpecularColor", "#ff6347")

lines = dataObject([8, 6], "float32")
lines[:, 0] = 3
lines[:, 1] = 3
lines[:, 2] = 7
for idx in range(8):
    lines[idx, 3] = 3 + 5 * np.sin(2 * idx * np.pi / 8)
    lines[idx, 4] = 3 + 5 * np.cos(2 * idx * np.pi / 8)
lines[:, 5] = 12
h.call("addLines", lines, "lines")
h.call("setItemProperty", "lines", "LineWidth", 3)
Places a 2D text to the given x, y coordinates (in screen coordinates). The third number argument
is 14pt; the last value is the optional color of the text
h.call("addText", "itom artwork", 200, 300, 14, "text", "#008866")

# general settings of the plot
h["cubeAxesVisible"] = True
h["xAxisInterval"] = (-15, 15)  # defines the extend of the cube axes
h["yAxisInterval"] = (-15, 15)
h["zAxisInterval"] = (-10, 10)
h["xDrawGridlines"] = True
h["yDrawGridlines"] = True
h["zDrawGridlines"] = True

Total running time of the script: (0 minutes 0.172 seconds)
